
This article provides context on how the stock market performs during election years.
This link from FirstTrust highlights every year going back to 1928.
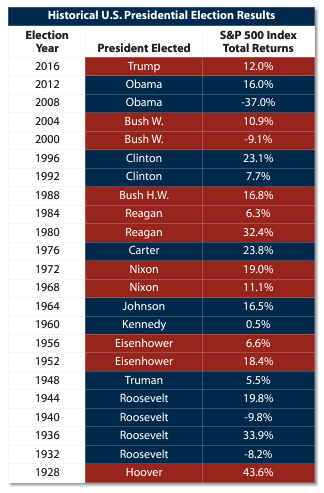
The Impact of. Elections on the Stock Market
Elections are pivotal moments in any democracy, shaping the future political landscape and influencing various aspects of society, including the economy and financial markets. In the United States, presidential and midterm elections are particularly noteworthy, as they can affect market sentiment, investor behavior, and stock market performance.
Historical Context: Elections and Stock Market Trends
The 2020 Election Year
The 2020 U.S. presidential election was unique due to the backdrop of the COVID-19 pandemic. The stock market, measured by the S&P 500 Index, experienced significant volatility throughout the year. According to data from Yahoo Finance, the S&P 500 plunged by over 30% in March 2020 due to COVID-19 but then rebounded sharply. The market volatility was partly due to uncertainty around election results and the pandemic’s economic impact.
Pre-Election Volatility: The market showed increased volatility in the months leading up to the election. Historical data suggests that this volatility often reflects investor uncertainty and speculation about future policy changes.
Post-Election Market Reaction: After Joe Biden’s victory was confirmed, the S&P 500 continued its upward trend, gaining about 70% from its March lows through the end of the year. This post-election rally can be attributed to investors’ relief over the resolution of political uncertainty and optimism about economic stimulus measures.
The 2016 Election Year
The 2016 election year provides another interesting case study. Leading up to the election, the stock market experienced fluctuations as investors weighed the potential outcomes and their implications for fiscal and monetary policy.
Pre-Election Trends: Prior to the 2016 election, the S&P 500 Index showed mixed performance. As detailed by CNBC, the market experienced jitters due to uncertainty around the possibility of Donald Trump’s presidency. The index rose and fell in response to polling data and campaign developments.
Post-Election Performance: After Trump’s victory, the stock market experienced a significant rally. The S&P 500 surged by approximately 5% in the immediate aftermath of the election, continuing to rise throughout his first year in office. This rally was driven by expectations of tax cuts and deregulation.
Key Factors Influencing Stock Market Performance During Elections
1. Political Uncertainty
Political uncertainty can create volatility in the stock market. Investors are often unsure how new policies will impact the economy, leading to market fluctuations.
For instance:
The 2008 Financial Crisis: During the 2008 election year, the U.S. was in the midst of a severe financial crisis. The market was highly volatile as investors were concerned about the direction of economic policy and the potential for further economic downturn.
The 1992 Election: In 1992, President George H.W. Bush faced economic challenges, and the stock market responded to uncertainties surrounding his re-election campaign. Bill Clinton’s victory led to a positive market response, as investors anticipated economic reforms and a more balanced budget.
2. Policy Expectations
Market performance often reflects investor expectations regarding potential policy changes.
For example:
Tax Policy: Changes in tax policy can significantly impact corporate earnings and investor sentiment. The 2017 Tax Cuts and Jobs Act, passed under President Trump, was anticipated to boost corporate profits, which contributed to the stock market’s positive performance in the subsequent years.
Regulation: Shifts in regulatory policy can also impact market performance. For instance, deregulation under the Trump administration led to a rally in sectors such as energy and financials.
3. Economic Stimulus
Expectations of economic stimulus or government spending can drive market performance. During election years, discussions about potential stimulus measures can lead to market optimism:
The American Recovery and Reinvestment Act of 2009: Enacted under President Obama, this stimulus package was seen as a response to the financial crisis. The market reacted positively to the anticipation of government support for the economy.
COVID-19 Stimulus Measures: In 2020, the anticipation of fiscal stimulus packages to counter the pandemic’s economic impact contributed to the market’s recovery after the initial downturn.
Analyzing Historical Data: Election Years and Market Performance
1. Long-Term Trends
Long-term trends show that election years can influence market performance, but the effects vary based on economic conditions, political developments, and investor sentiment.
Historical Data: According to data from S&P Dow Jones Indices, the average annual return of the S&P 500 during election years has been generally positive, though with considerable variability. For instance, from 1928 to 2020, the average return during presidential election years was around 10.6%, compared to a long-term average of approximately 9.6%.
2. Midterm Election Years
Midterm elections also impact the stock market. Historically, midterm election years have shown distinct patterns:
Performance Trends: Data from the Stock Trader’s Almanac shows that the S&P 500 Index often underperforms in the months leading up to midterm elections but tends to perform better in the latter half of the year. This pattern is often attributed to the uncertainty surrounding Congressional control and potential policy changes.
Post-Midterm Rally: Historically, the stock market often experiences a rally following midterm elections, driven by reduced uncertainty and clearer expectations for policy outcomes.
Case Studies and Data Analysis
1. The 1980 Election
The 1980 presidential election, where Ronald Reagan defeated Jimmy Carter, saw significant market reactions:
Pre-Election Performance: The stock market was volatile during the lead-up to the election as investors anticipated changes in economic policy.
Post-Election Rally: After Reagan’s victory, the stock market surged, with the S&P 500 gaining approximately 25% in the following year. This rally was fueled by expectations of lower taxes and deregulation.
2. The 1964 Election
In 1964, President Lyndon B. Johnson defeated Barry Goldwater:
Pre-Election Trends: The market showed volatility due to concerns about the potential impact of Goldwater’s policies.
Post-Election Performance: Following Johnson’s victory, the stock market performed well, with the S&P 500 experiencing a significant increase. Johnson’s focus on social programs and economic growth contributed to investor optimism.
Conclusion
Elections play a significant role in shaping stock market performance. Historical data indicates that while election years often bring volatility and uncertainty, they also present opportunities for market rallies once political outcomes become clear. Factors such as political uncertainty, policy expectations, and economic stimulus influence market behavior during these periods.
Understanding these dynamics can help investors navigate the complexities of election years and make informed decisions. By analyzing past election cycles and their impact on the stock market, investors can better anticipate market trends and adjust their strategies accordingly.
The effect of elections on the stock market is a multifaceted phenomenon influenced by a range of factors. By studying historical data and trends, investors can gain valuable insights into how elections may impact future market performance and make more informed investment decisions.
An election year may be a great time to buy stocks!
You are welcome to join Tykr for free!
Tykr has a Trustindex score of 4.9/5.0.